


Why Toncoin (TON) Could Be Setting Up for an 800% Rally – Whale Buying & 2023 Fractal Repeat
 TON
TON
Key Highlights
- Toncoin whales accumulated 189,730 TON over the past 3 months, signaling growing long-term confidence despite the downtrend.
- TON has lost nearly two-thirds of its market cap since its August 2025 peak, yet accumulation suggests a potential relief rally ahead.
- Price is holding near $1.12 key support, where a similar setup in 2023 triggered a ~185% rally after forming an inverse head and shoulders pattern.
- Bullish confirmation requires a reclaim of the 50-week MA ($2.31) and a breakout above $4.20 neckline, while a drop below $1.12 invalidates the setup.
Toncoin (TON) is currently trading at $1.28, posting a notable +4.63% gain in the last 24 hours. However, the token remains under pressure on a longer timeframe, down 26.01% over the past 90 days. With a market capitalization of approximately $3.18 billion, TON continues to rank among the top 30 cryptocurrencies, demonstrating resilience despite the broader market challenges and a significant drawdown from its early June 2024 local high.
 Toncoin (TON) Price/Source:: Coinmarketcap
Meanwhile, the latest whale activities and technical developments hint at a major reversal, suggesting that the current weakness could be nearing its end despite the significant drawdown from its early August 2025 local high.
Whale Accumulation Signals Confidence
One of the most notable developments is the steady accumulation by large holders. Over the past three months, TON’s 100 largest whale addresses have added 189,730 TON to their holdings.
This accumulation comes despite the token losing nearly two-thirds of its market cap since its local top in early August 2025. Such behavior often reflects long-term conviction, as smart money tends to accumulate during periods of weakness rather than strength.
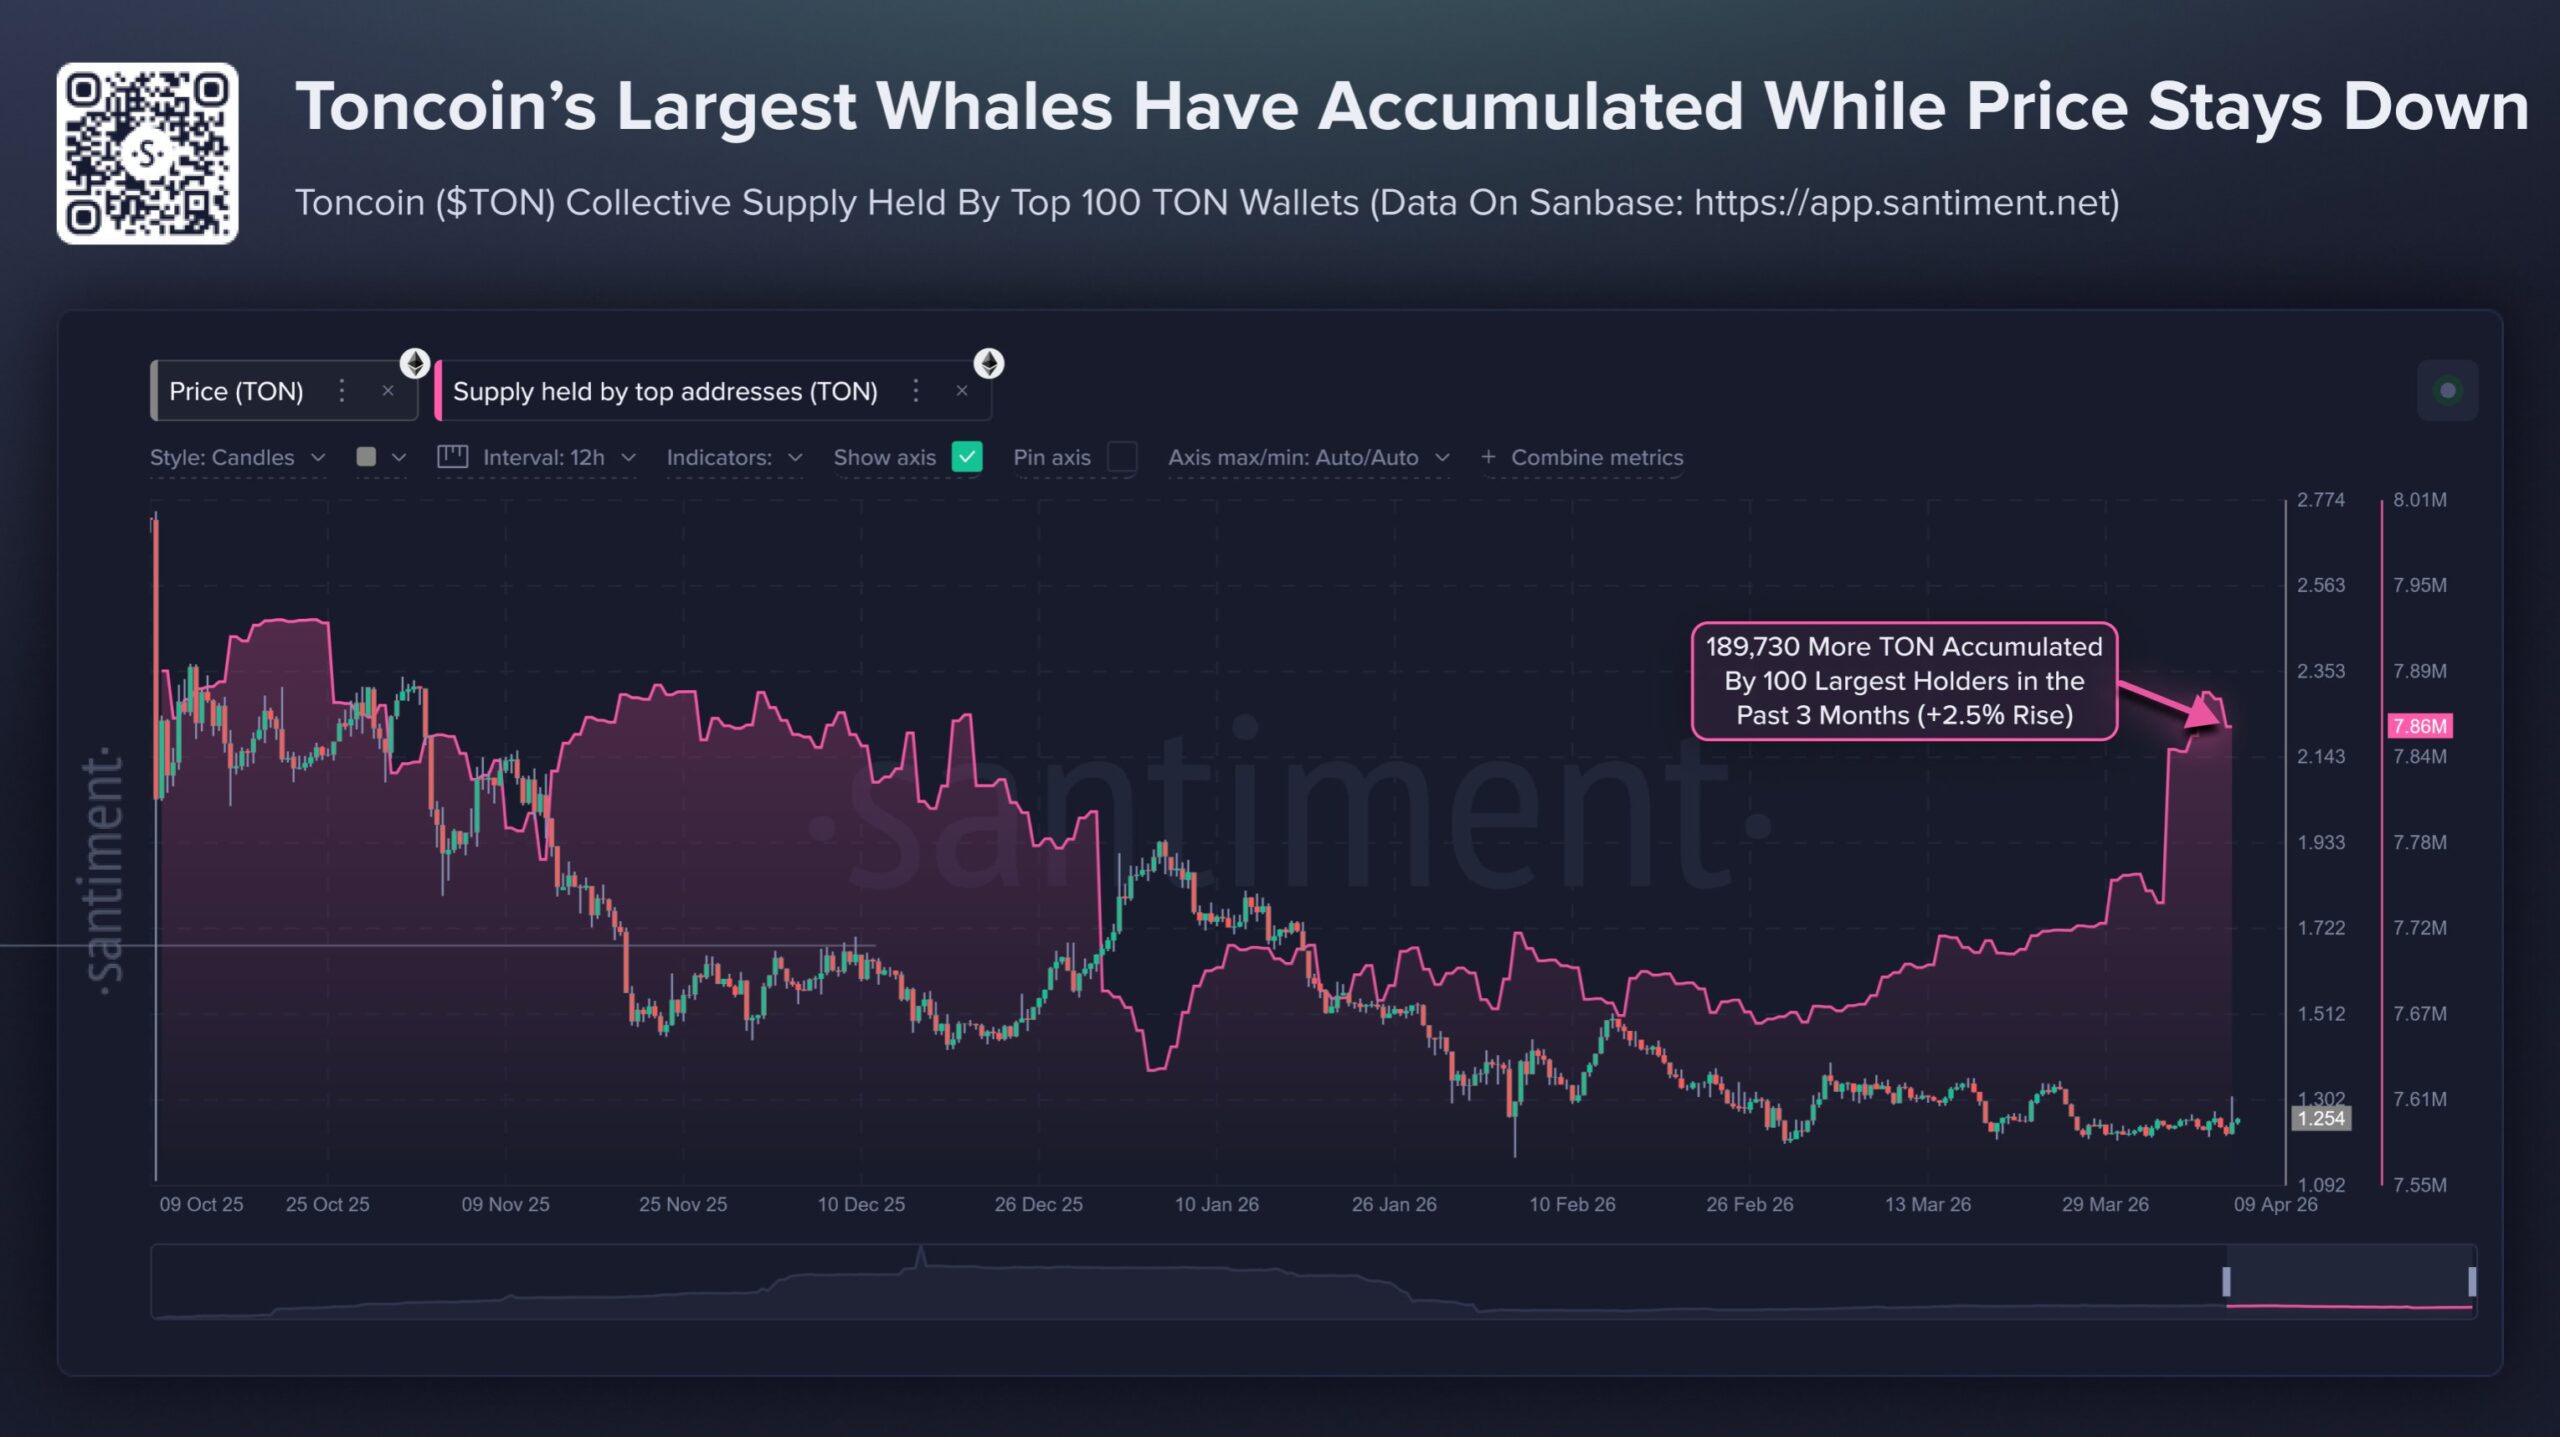 Toncoin’s 100 Largest Whales Accumulation/Source: @santimentfeed (X)
Historically, sustained whale accumulation during downtrends has preceded relief rallies, especially when broader market conditions begin to stabilize. In TON’s case, this growing concentration of supply among large holders could act as a foundation for a potential recovery once sentiment improves.
Fractal Analysis Hints at Bullish Reversal
From a technical perspective, the weekly chart is starting to tell a familiar story.
TON is currently establishing support near the $1.12 region, which coincides with a key historical level. Back in July 2023, this same zone acted as a base for a major reversal, where TON formed an inverse head and shoulders pattern, reclaimed the 50-week moving average, and broke out above its neckline — ultimately triggering a ~185% rally toward its long-term ascending resistance trendline.
Now, a similar structure appears to be forming again.
 Toncoin (TON) Weekly Chart/Coinsprobe (Source: Tradingview)
Price action suggests TON could be developing another inverse head and shoulders pattern, with the current phase potentially shaping the “head.” At the same time, the token is trading below its 50-week MA (around $2.3145), indicating that bullish confirmation has not yet been achieved.
Still, the resemblance to the previous cycle is notable — and if the pattern continues to develop, it could signal the early stages of a larger trend reversal.
What’s Next for TON?
If this fractal setup continues to play out, the bullish scenario would unfold in stages.
The first key signal would be a reclaim of the 50-week moving average, which would suggest that momentum is shifting back in favor of buyers. From there, the next major milestone lies at the neckline resistance near $4.2065.
A confirmed breakout above this level would complete the inverse head and shoulders structure and could trigger a strong bullish expansion. In such a case, the next major target would sit near the $11.50 region, aligning with TON’s long-term ascending resistance trendline.
However, the setup is not without risk. A breakdown below the $1.1277 support level would invalidate the pattern and signal continued downside pressure, potentially delaying any recovery.
Bottom Line
While Toncoin remains in a broader downtrend, the combination of whale accumulation and a repeating bullish fractal structure is starting to build a compelling case for a potential reversal.
Confirmation is still needed, but if key levels are reclaimed, TON could be setting up for a significant comeback in the next market cycle.
FAQs
Why are Toncoin (TON) whales accumulating?
Large holders are accumulating TON despite the price drop, which often signals long-term confidence and the possibility of a future recovery or relief rally.
What is the key support level for TON right now?
TON is holding a crucial support near $1.12, a level that previously triggered a major bullish reversal in 2023.
What pattern is forming on TON’s chart?
TON appears to be forming a potential inverse head and shoulders pattern, which is a bullish reversal structure.
What confirms a bullish breakout for TON?
A reclaim of the 50-week moving average (~$2.31) followed by a breakout above the $4.20 neckline would confirm a strong bullish trend.
What is the upside target for TON if it breaks out?
If the pattern completes, TON could rally toward the $11.50 level, aligning with its long-term resistance trendline.
What could invalidate the bullish setup?
A breakdown below the $1.12 support level would invalidate the bullish structure and suggest further downside.
Disclaimer: The views and analysis presented in this article are for informational purposes only and reflect the author’s perspective, not financial advice. Technical patterns and indicators discussed are subject to market volatility and may or may not yield the anticipated results. Investors are advised to exercise caution, conduct independent research, and make decisions aligned with their individual risk tolerance.
Read Also: Algorand (ALGO) Drops to Test Critical Wedge Support — Rebound and Breakout Ahead?
