Something rare just happened to a token most traders had quietly written off. And it happened fast, almost overnight. Was this a one-day spike, or the start of something the charts had been s
Something rare just happened to a token most traders had quietly written off. And it happened fast, almost overnight. Was this a one-day spike, or the start of something the charts had been setting up for weeks? Away from the candles, the project behind this token has been running a buyback engine tied straight to real telecom revenue in the Philippines. Here's what the daily chart, the weekly wedge, and the tokenomics table mean for this World Mobile Token price prediction right now.
$WMTX Token Overview
Metric
Value
Token
World Mobile Token (WMTX)
Chain / Standard
Ethereum, ERC-20
Contract Address
0xDBB5Cf12408a3Ac17d668037Ce289f9eA75439D7
Current Price
$0.0432
Market Cap
$37.9M
Fully Diluted Value
$88.3M
Circulating Supply
859M WMTX
Max Supply
2B WMTX
Whitepaper
World Mobile Whitepaper
Full tokenomics and vesting terms are laid out in the project's whitepaper, linked above.
Why WMTX Is Breaking Out Today
This World Mobile Token price prediction matters because $WMTX trades near $0.0432 after a move CoinMarketCap put at more than 80% on the day. That's not a typo. Turns out, the daily descending channel that capped the price since May just got broken with force.
The daily RSI jumped to 66.43, not overbought yet but close. Weekly RSI still sits soft at 41.62. So this isn't an overheated coin cooling off; it's a coin testing whether a real trend change is underway. This World Mobile Token price prediction for 2026 leans on that breakout holding, not just happening once.
Why WMTX Is Moving Today
There's no single dramatic headline here. But the project itself has been busy. World Mobile Chain's own account said the flippening of Helium was inevitable, pointing to $WMTX passing HNT inweekly market cap rankings, with $WMTX now the ticker leading revenue among decentralized wireless networks.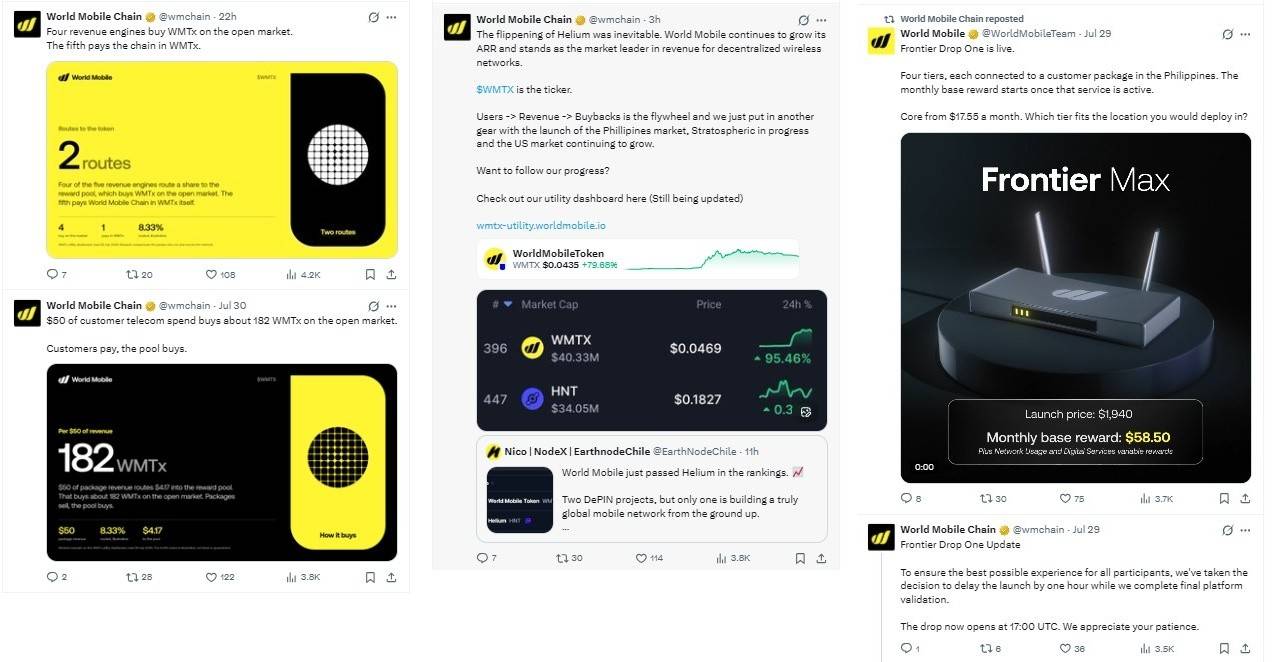
And the timing lines up with Frontier Drop One going live in the Philippines, four hardware tiers each tied to a customer package, and monthly rewards starting once service activates. The core tier starts from $17.55 a month.
Here's the thing: every $50 of customer telecom spend reportedly routes about $4.17 into theopen market reward pool, buying roughly 182 WMTX. Users pay, the pool buys.
WMTX Technical Analysis: Daily Chart
On the daily chart, WMTX closed near $0.0432, breaking above its descending channel ceiling on strong volume after weeks of grinding lower. Price sits well above the 20-period Bollinger band near $0.0288, with the upper band stretched to roughly $0.0417. Daily resistance stacks at $0.0588, then $0.0697.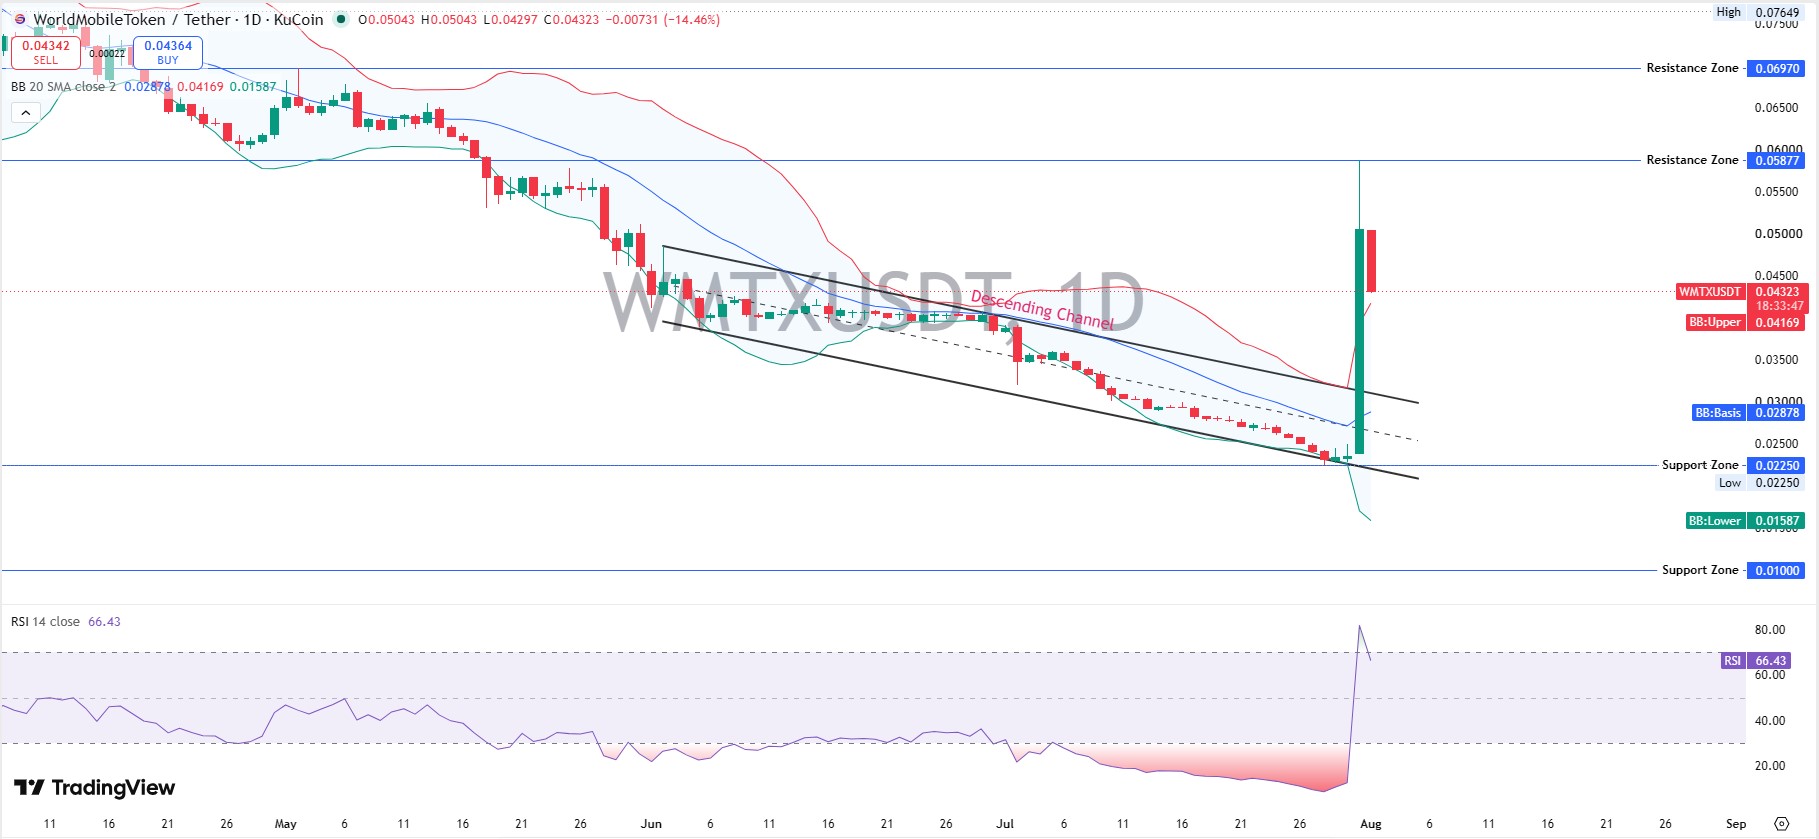
Support now sits at $0.0295 and then $0.0225, the recent low. When we pulled up the daily RSI, the first thing that stood out was the speed of the move, not just the level. A pullback that holds above $0.0387, the old channel line, keeps this bullish. Losing that fast would question the whole breakout.
WMTX Technical Analysis: Weekly Chart
Zoom out, and WMTX is still technically inside a multi-month falling wedge stretching back toward its 2022 high near $0.98. This week's candle closed near $0.0432, up sharply, tightening right against the wedge's upper trendline.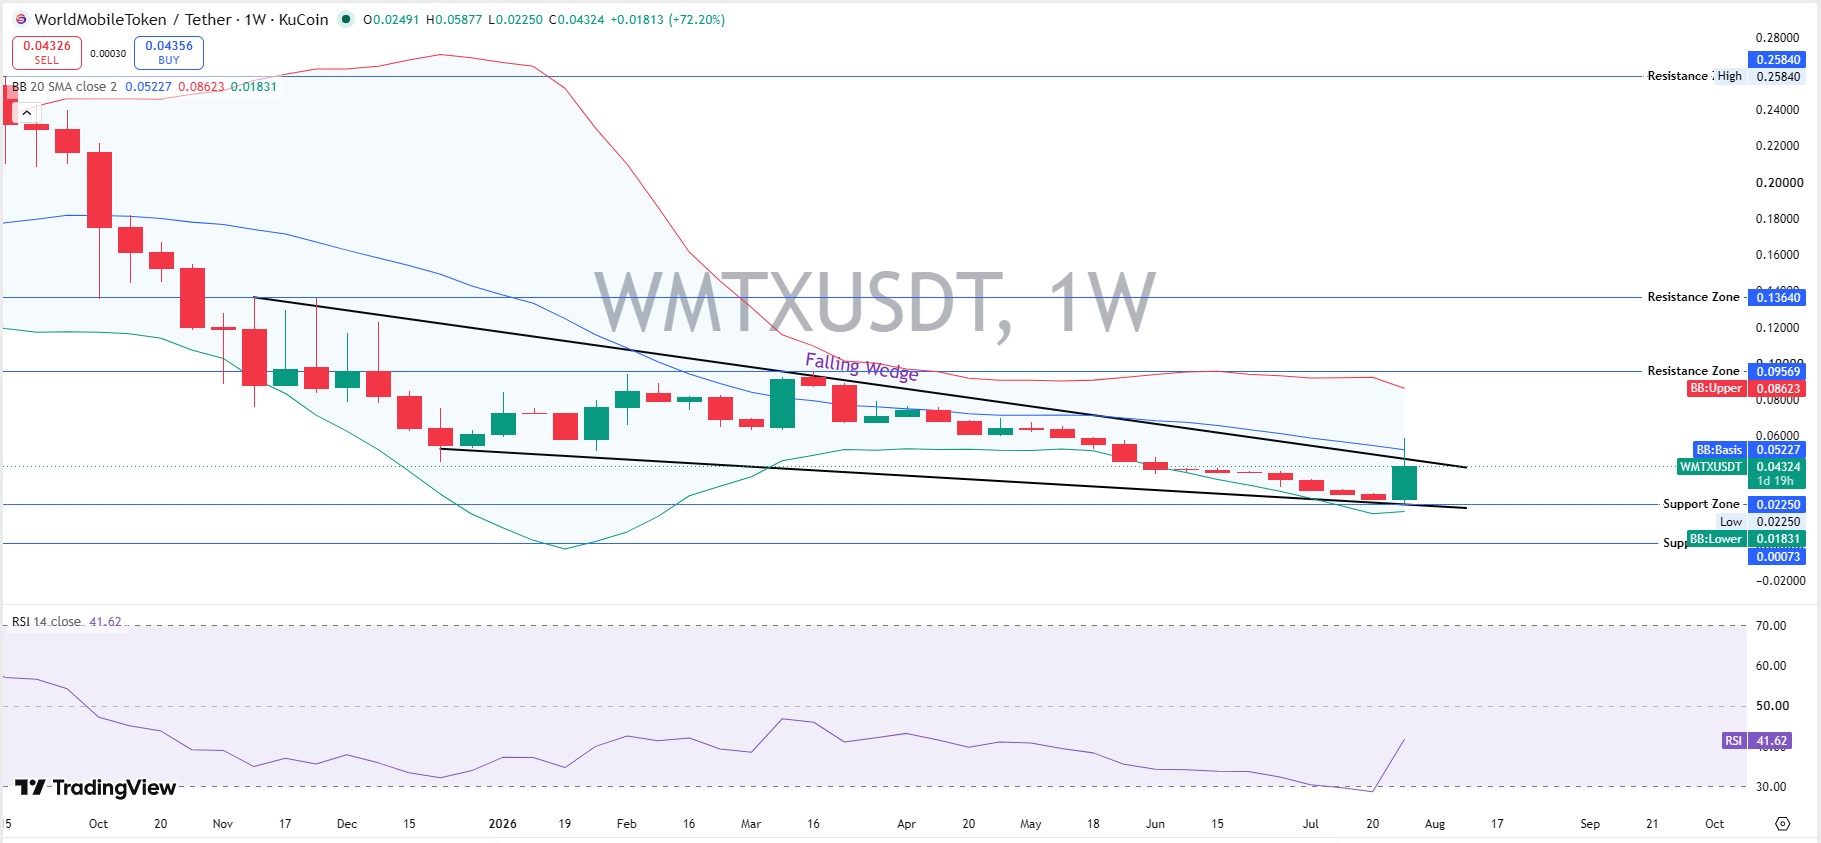 Weekly resistance sits overhead at $0.0957, then $0.1364, then $0.2584. Weekly support holds near $0.0225, close to the all-time low set just three days ago. Turns out, falling wedges usually resolve upward once broken, though one strong weekly candle isn't full confirmation on its own.
WMTX Support And Resistance Levels
Immediate support: $0.0387, then $0.0295, then $0.0225.
Immediate resistance: $0.0588, then $0.0697, then $0.0957. A weekly close above $0.0588 would confirm the wedge break properly. A close back under $0.0295 breaks both patterns at once, the real invalidation line here.
WMTX Price Prediction: Scenarios By Timeframe
Timeframe
Bull Case
Base Case
Bear Case
24H
Holds above $0.0417, tests $0.0588 (moderate)
Chops between $0.038-$0.045 (high)
Slips under $0.0387 toward $0.0295 (low)
7D
A daily close above $0.0588 opens $0.0697 (low-moderate)
Range-bound above the old channel line (high)
Weekly close under $0.0295 confirms breakdown (moderate)
Aug 2026
Wedge resolves up, targets $0.0697-$0.0957 (low-moderate)
Drifts $0.035-$0.06 tracking buyback and adoption news (moderate)
Breaks $0.0225, retests the all-time low (low)
Invalidation for the bullish case is a daily close under $0.0387. A weekly close under $0.0295 would be the deeper warning sign.
Tokenomics And Whale Concentration
The circulating supply runs near 859 million against a 2 billion max, per CoinMarketCap, giving a market cap near $37.9 million against an FDV of $88.3 million. On-chain, concentration runs heavy.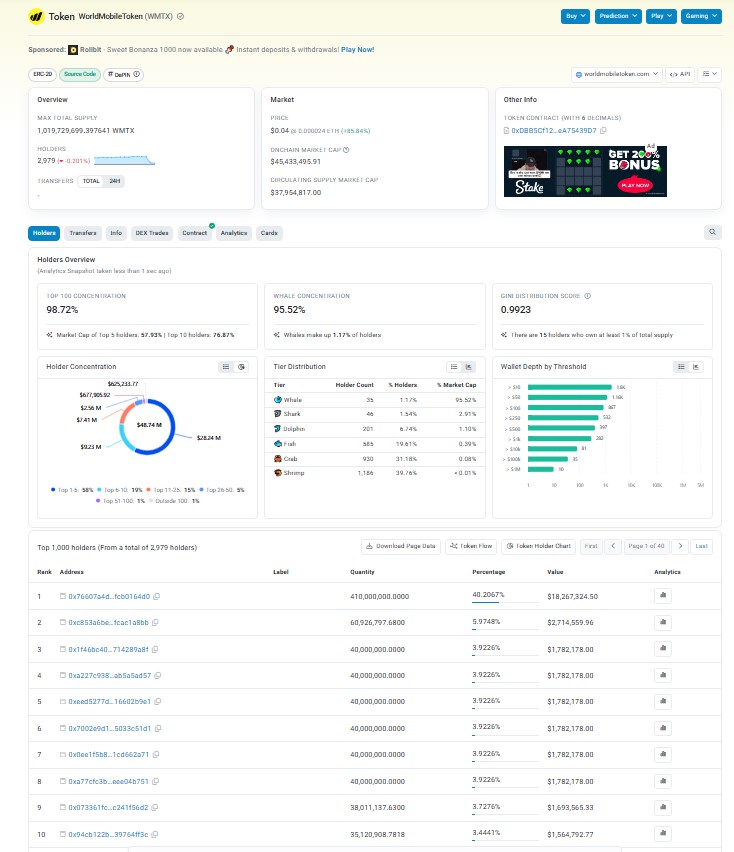
The largest tracked wallet alone holds over 40% of the supply, and just 35 whale wallets control over 95% of the market cap.
Node operator and staking rewards take 29% of total token allocation, with team and founder tokens still vesting monthly through 2028.
The full breakdown by group and lockup schedule:
Distribution Group
Percentage
Initial Lockup
Monthly Unlocks
Private Sale
2.5%
9 months
none
Public Sale
10%
none
none
Incentive Rewards
3%
none
none
Early Staking Rewards
2.5%
none
none
Advisors
5.9%
12 months
24 months
Co-founders and Team
19.25%
18 months
24 months
Partnerships
7.85%
12 months
none
WM Community Fund
2%
24 months
48 months
WM Operations Fund
18%
6 months
72 months
Node Operators/Staking
29%
none
none
Source:World Mobile Whitepaper
WMTX Market Outlook: Risks To Watch
Whale concentration tops the list, even with genuine buyback demand behind it. And a move this size after weeks of decline invites a sharp retrace. This isn't a guaranteed continuation; it's a base case leaning bullish with a hard invalidation under $0.0295.
For sector context, thecrypto price prediction hub tracks similar post-breakout setups across the market.
Bitcoin's own2026 price outlook offers a wider read on where broader sentiment sits right now.
Methodology: Chart levels came from WMTX/USDT daily and weekly charts on KuCoin via TradingView, using RSI-14 and 20-period Bollinger Bands, captured August 1, 2026, around 12:00 UTC. Price, supply, and market-cap data came from CoinMarketCap. Holder concentration came from on-chain token-holder analytics for contract 0xDBB5Cf12408a3Ac17d668037Ce289f9eA75439D7 on Etherscan. Revenue and buyback figures came from World Mobile Chain's official account on X, cross-checked against the project whitepaper.
Disclaimer: This is speculative market commentary, not financial or investment advice. Crypto assets are volatile and can lose most or all of their value. Verify live figures before trading.