XRP price hit $1.16 during the ongoing crypto market recovery. The token is now trading at $1.14 at press time after a small pullback, which is in line with how the market behaved in the last
XRP price hit $1.16 during the ongoing crypto market recovery. The token is now trading at $1.14 at press time after a small pullback, which is in line with how the market behaved in the last few hours.
The broader crypto market is showing strength. Bitcoin is approaching $67,000. Ethereum is above $1,900. Altcoins are bouncing. XRP followed the recovery but is now consolidating.
And in the meantime, my favorite analyst who posts XRP price predictions, CasiTrades, just updated her XRP outlook again.
CasiTrades: The Levels That Confirm a Macro XRP Reversal
CasiTrades posted her latest XRP analysis on July 21. Her message was clear: the purple bearish scenario continues to play out.
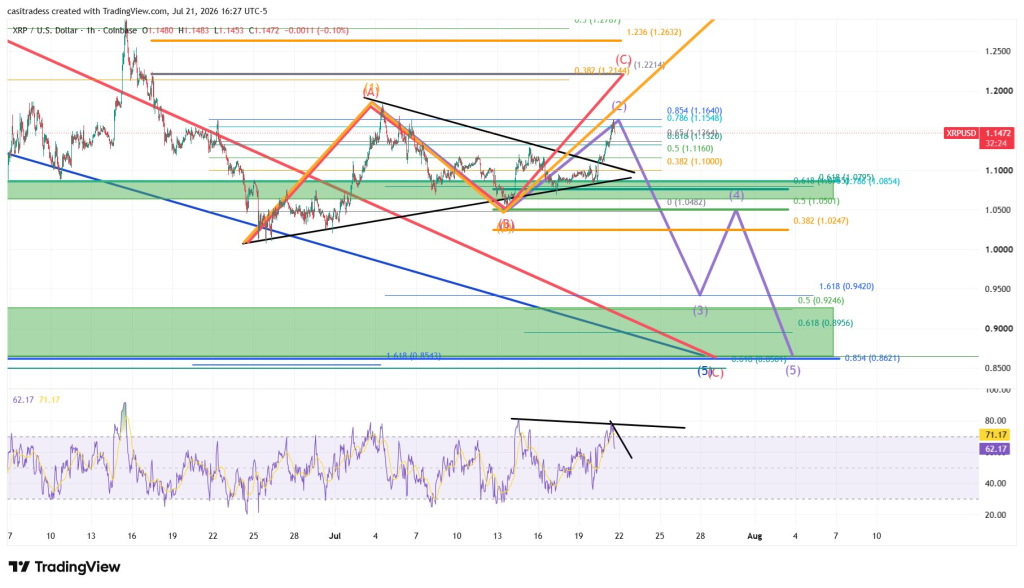
The “Wave 2 correction” has now reached an .854 retrace , perfectly at $1.16. That is a deep retracement, but it is still completely valid for a Wave 2. The only rule from here is that price cannot make a new high above $1.20 , or the purple count will be invalidated.
That touch at $1.164 also created bearish RSI divergences across multiple degrees, confirming a top.
Here is what she is watching next:
To confirm the purple bearish scenario: Price should begin breaking down with momentum from here. The path toward the lower supports $0.93 and $0.87 remains intact.
To start entertaining the idea that the bottom is in: XRP first needs to break above $1.20 (invalidating purple), then clear $1.30 (invalidating C), and continue toward $1.65 , which is the major macro resistance that would truly challenge the bearish outlook.
XRP Chart Analysis: The Wave 2 Retracement and Bearish Divergence
The attached 1‑hour chart from CasiTrades shows XRP/USD on Coinbase.
Price action: XRP is trading at$1.1472 at the time of the chart. The price hit $1.164 before pulling back. That move perfectly touched the .854 retracement level, confirming a deep Wave 2 correction.
 Source: X/@CasiTrades
Key levels:
- Resistance: $1.164 is the recent high. Above that, $1.20 is the invalidation level for the purple count.
- Next resistance: $1.30 and $1.65 are the levels that would confirm a trend reversal.
- Support: $1.10 is immediate support. Below that, $1.00 and $0.93 are the next downside targets.
- Major target: $0.87 remains the primary downside destination.
Bearish divergence: The chart shows bearish RSI divergences across multiple degrees. Price made a higher high at $1.164, but the RSI made a lower high. That is a classic bearish signal that confirms the top is likely in.
Wave structure: The XRP chart shows a deep Wave 2 retracement. Wave 2 corrections can retrace up to 100% of Wave 1, so the .854 retrace is valid. The key is that Wave 2 cannot exceed the start of Wave 1. That invalidation level is $1.20.
Santiment: XRP Whales Accumulate While Micro Wallets Dump
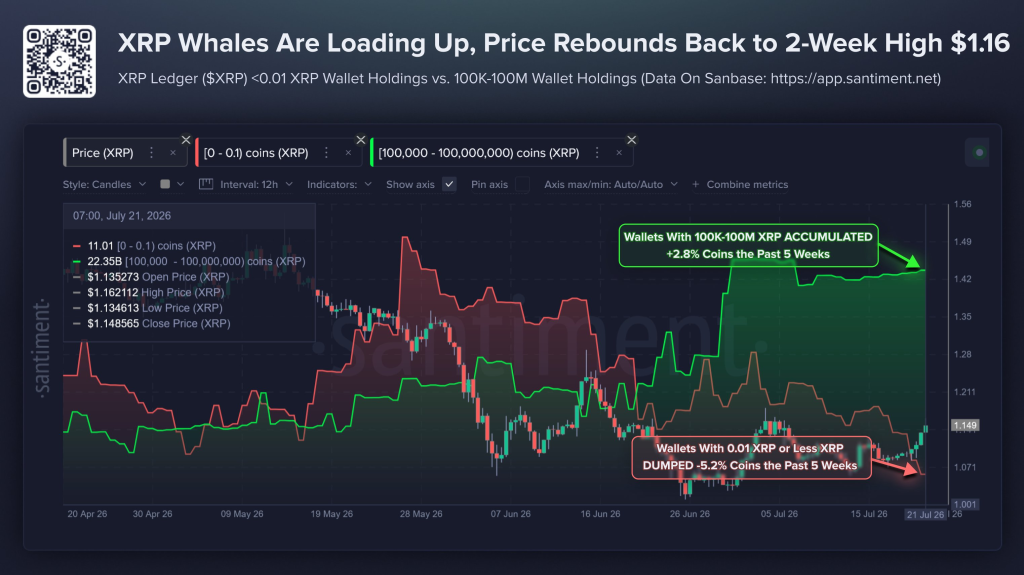
Santiment’s new report supports the current price action.
Whales and sharks holding 100,000 to 100 million XRP have added +2.8% more coins to their bags in five weeks. This shows whales and sharks are leaning in while the chart finally starts rewarding patience.
Micro wallets with under 0.01 XRP have dumped -5.2% over the same stretch. Historically, XRP price has tended to move more with key stakeholders and against the smallest retail wallets. This split supports the bullish case behind the bounce.
Source: X/@SantimentData
The timing also fits XRP’s improving market story:
- Institutional access through XRP ETF products
- Ripple’s resolved SEC overhang
- Continued XRPL utility around payments, tokenization, and RLUSD
When stronger holders accumulate while micro wallets lose interest, it is often the kind of quiet setup that can support further upside.
Read also: ChatGPT vs. Grok: Which AI Has the More Bullish XRP Price Prediction?
Where Could XRP Price Go From Here?
CasiTrades’ bearish scenario remains valid as long as XRP stays below $1.20. The deep Wave 2 retracement and bearish RSI divergence point to a continuation lower.
Bearish scenario: If the XRP price breaks down from here, the path leads to $0.93 and then $0.87. That would complete the macro correction and set up the next major trend.
Bullish scenario: If the XRP price breaks above $1.20 , the purple count is invalidated. A move above $1.30 would further weaken the bearish case. The key level is $1.65 , which would truly challenge the bearish outlook and confirm a macro reversal.
Our take: The bearish scenario still has the edge. The Wave 2 retracement and bearish divergence are clear. The whale accumulation data is bullish, but it does not override the technical structure. The $1.20 level is the line in the sand. Until that breaks, the path of least resistance is lower.
I am watching $1.20 closely. A break above that would change the entire picture.
FAQs
What does the XRP whale accumulation data show
Whales and sharks added +2.8% more XRP in five weeks. Micro wallets dumped -5.2% over the same period.
Does XRP have a futureYes, XRP’s future is tied to its role in cross-border settlements, tokenization, and institutional finance, with Ripple building infrastructure while the Clarity Act could unlock regulatory clarity and ETFs continue to attract inflows. However, the short-term price is still correcting, and the macro technical outlook points to one more leg down before the next major expansion.
How long before XRP explodesIf the bearish wave count plays out, XRP could bottom near $0.87 in the coming weeks or months before the next major rally begins, but a true explosive move likely depends on the Clarity Act passing and institutions fully entering the space, which could happen in late 2026 or early 2027. The $1.65 level is the key confirmation that the correction is over and a new trend has started.
Subscribe to our YouTube channel for daily crypto updates, market insights, and expert analysis.
The post XRP Price Is One Level Away from Invalidating the Bearish Scenario! appeared first on CaptainAltcoin.