Zcash price prediction watchers have gone through a genuine mood swing recently, and it shows right there on the chart. What was a clean descending trendline just days ago has now been broken
Zcash price prediction watchers have gone through a genuine mood swing recently, and it shows right there on the chart.
What was a clean descending trendline just days ago has now been broken, and ZEC is climbing along a brand new ascending trendline instead.
Reversals like this do not happen every week, which is exactly why this one is worth a closer look.
This breakdown uses chart structure, CoinGlass data, and on-chain holder data supplied for this piece.
The levels discussed here come from the 1-hour ZEC perpetual chart and represent a short-term view.
If the price moves decisively outside these ranges, this Zcash price prediction should be revisited rather than assumed to still apply.
Zcash ($ZEC) Price Right Now
Metric
Value
Current Price (CMP)
$494.63
24-Hour Change
+2.58% (+12.423)
Market Cap
$8.31B
Futures Volume (24h)
$1.32B
Spot Volume (24h)
$100.05M
Open Interest
$882.49M
Circulating Supply
16.81M ZEC
Total Supply
16.81M ZEC
Max Supply
21.00M ZEC
Open interest sits at $882.49M right now, which is the total value of ZEC futures contracts still open on the market.
That figure has climbed alongside the recent rally, a combination that usually points to fresh conviction rather than just short covering.
Chart source: TradingView, ZEC/USDT, OKX, 1-hour timeframe, captured 13 August 2026, around 3:55 PM IST (10:25 AM UTC).
Data source: CoinGlass, Zcash market page, captured 13 August 2026, around 3:55 PM IST.
Methodology and Data Sources
The structure behind this Zcash price Outlook comes from a direct reading of the 1-hour ZEC perpetual chart on OKX, tracking the trendline break, the new ascending trendline, and the horizontal levels marked on it.
Market figures such as volume, open interest, and supply data are pulled from CoinGlass, liquidation numbers come from CoinGlass's liquidation tracker for ZEC, and holder distribution data is sourced from an on-chain analytics dashboard.
Where ZEC Trading Volume and Holdings Are Concentrated
A look under the hood of ZEC's market structure adds useful context to this Zcash forecast. 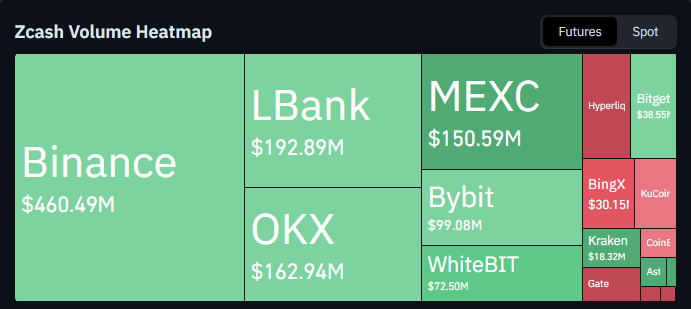
On the trading side, Binance dominates futures volume with $460.49M, well ahead of LBank at $192.89M, OKX at $162.94M, and MEXC at $150.59M. Bybit and WhiteBIT follow with $99.08M and $72.50M, respectively, with a long tail of smaller exchanges like Bitget, BingX, and Kraken splitting the rest.
On the holder side, concentration is notably tight.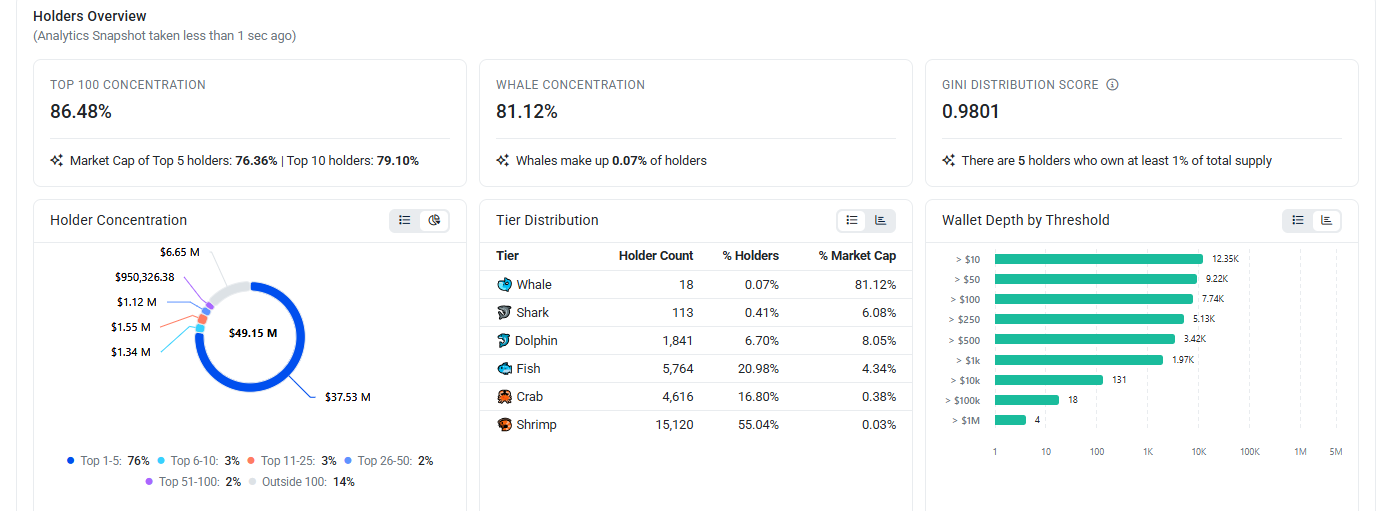
The top 100 wallets control 86.48% of circulating supply, and whale wallets alone, just 18 of them, account for 81.12% of market cap despite making up only 0.07% of all holders.
The Gini distribution score sits at 0.9801, reflecting how heavily skewed ownership is toward a small group.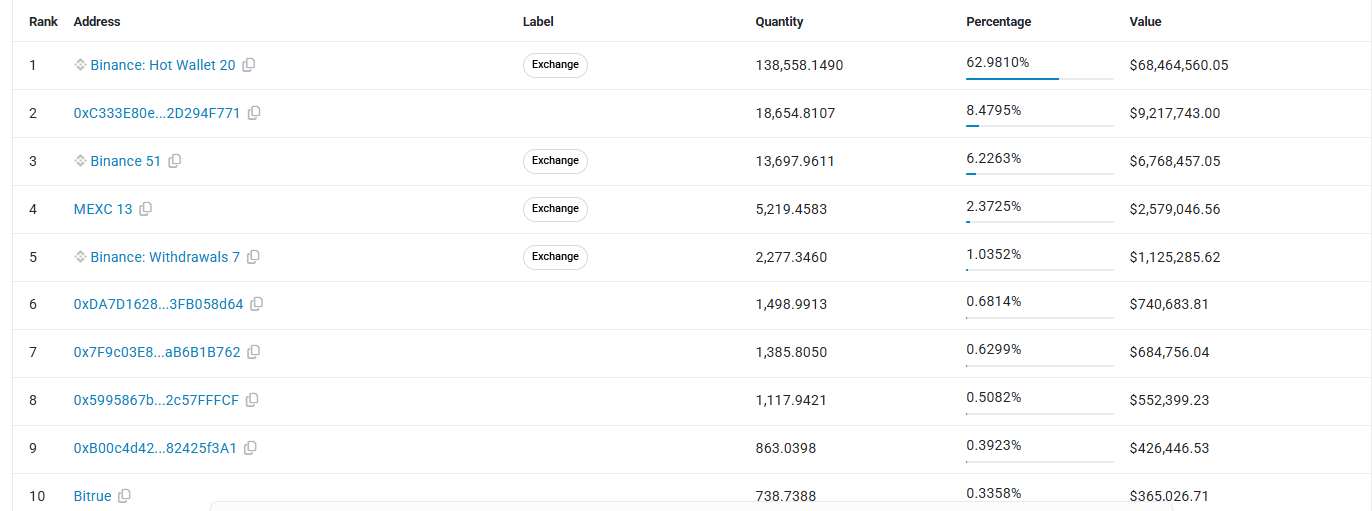
The single largest wallet is a Binance hot wallet holding 138,558.1490 ZEC, close to 62.9810% of the total supply, which is almost certainly exchange custody rather than one individual's holdings.
Still, this level of concentration is worth keeping in mind for anyone treating ZEC's supply-demand picture as purely retail-driven.
Source: On-chain holder analytics dashboard, ZEC holder distribution, captured 13 August 2026.
ZEC Liquidation Data Today
Liquidation flow on ZEC over the shorter windows is entirely one-sided toward longs, a small but notable detail given the rally underway.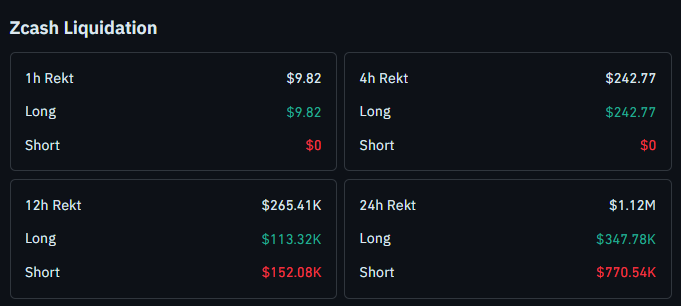
The last hour saw just $9.82 in total liquidations, all of it from long positions, with shorts at $0.
The 4-hour window shows $242.77 in total liquidations, again entirely from longs.
Zooming out to 12 hours, rekt totals reach $265.41K, with $113.32K from longs and a larger $152.08K from shorts.
Across the full 24 hours, total liquidations hit $1.12M, made up of $347.78K in longs and a much heavier $770.54K in shorts.
The wider 24h picture shows shorts absorbing far more damage overall, which fits a market that has been climbing steadily and catching late sellers off guard.
Source: CoinGlass, ZEC liquidation data, captured 13 August 2026.
Zcash Trend and Momentum: Key Takeaways
It is trading at 494.63, having broken its old descending trendline and rallied on a fresh ascending trendline since
A hold above 489.10, where the new trendline also sits, keeps 530.50 and 550 in view as upside targets
A trendline break with a close below the 478.70 to 480.20 flip zone would invalidate the current buying setup
Holder concentration is extremely high, with just 18 whale wallets controlling over 81% of market cap
Short liquidations dominate the 24h window even as long liquidations take the brunt of the 1h and 4h windows
Leveraged positions around any of these zones carry real liquidation risk, as the numbers above show.
These levels describe a chart-based framework, not a guarantee of what comes next.
Zcash Price Prediction: 1-Hour Chart Analysis
It spent the earlier part of this move sliding down a descending trendline, the kind of structure that usually keeps sellers in control for a while.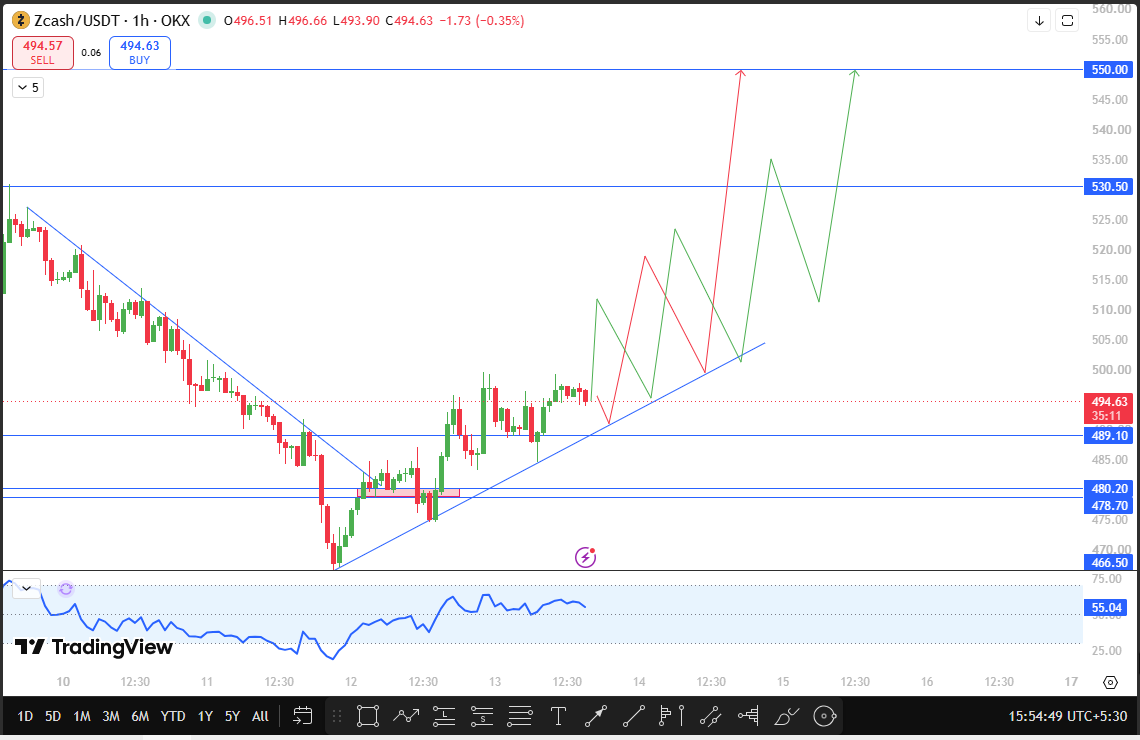
That changed recently when price broke through the trendline cleanly and, instead of just bouncing once and fading, kept climbing along a brand new ascending trendline that has formed since.
That shift from a bearish structure to a bullish one is the core of this Zcash price prediction.
It is currently holding above the 489.10 zone, and this is not just a horizontal level; the new ascending trendline runs right through roughly the same area.
Two forms of support lining up in one place tends to make that zone matter more than either would alone.
If ZEC continues to hold here, the first target in view is 530.50, about 7.25% above CMP.
A move through that level opens the door to 550, close to 11.2% higher, which would mark a meaningful continuation of the reversal already underway.
The other side of this setup is just as clear.
A break of the ascending trendline with a close inside the 478.70 to 480.20 flip zone, roughly 2.92% to 3.22% below CMP, would undo the bullish case built on this new structure.
That zone is the line between ZEC's recent reversal holding and it turning back into just another failed bounce.
Zcash Technical Outlook Snapshot
Indicator
Signal
Price Structure
Descending trendline broken, new ascending trendline forming support
Momentum Oscillator RSI
Reading near 55.04, recovering steadily from oversold levels
Immediate Bias
Cautiously bullish above 489.10
Bullish Trigger
Sustained hold above 489.10
Bearish Trigger
Close below the 478.70 to 480.20 flip zone.
Invalidation
Close Below 466.50
Zcash Support and Resistance Levels to Watch
Type
Level
Note
% From CMP
Resistance
$550.00
Second upside target
+11.2%
Resistance
$530.50
First upside target
+7.25%
Current Price
$494.63
Live CMP
0%
Support
$489.10
Trendline confluence, key support
-1.12%
Support
$480.20
Upper edge of flip zone
-2.92%
Support
$478.70
Lower edge of flip zone, breakdown trigger
-3.22%
Support
$466.50
Deeper invalidation level
-5.69%
ZEC Risk-Reward Table
Case
Trigger
Target
Bullish continuation
Hold above 489.10.
530.50, then 550
Bearish breakdown
Close inside the 478.70 to 480.20 flip zone.
Buying setup invalidated
Deeper breakdown
Close to 466.50
Reversal structure fully at risk
Invalidation Level
This price prediction treats a close below 466.50 as the deeper invalidation point for the current bullish reversal.
A close inside the 478.70 to 480.20 flip zone already weakens the setup considerably, and a further break below 466.50 would undo the case for this trend flip holding altogether.
Trading around any of these zones on leverage carries genuine risk.
A brief dip into the flip zone followed by a quick recovery is possible before either direction truly confirms, and the liquidation data above shows how fast overleveraged positions can get wiped out during moves like this.
How Bitcoin Could Influence Zcash
Bitcoin sentiment remains relevant for this ZEC crypto forecast, even with ZEC's own trendline reversal driving most of the recent move.
A stable or rising Bitcoin would likely help ZEC clear 530.50 and build toward 550 with less friction.
A risk-off-shift in Bitcoin, on the other hand, would make a break of the 478.70 to 480.20 flip zone more likely even after this reversal.
Glossary
Descending Trendline: A line connecting a series of lower highs, used to track the pace and structure of a downtrend. Ascending Trendline: A rising support line connecting a series of higher lows, used to track an uptrend's structure. Flip Zone: A price area that previously acted as resistance or support and is being retested from the opposite side to confirm the trend change. Whale Concentration: The share of total supply or market cap held by the largest wallet addresses on a network. Invalidation Level: The price point at which a technical outlook is no longer considered valid, requiring the setup to be reassessed.
CoinGabbar's Technical Analyst View
Bull Case: Price holds above 489.10 and the new ascending trendline, clearing 530.50 before extending toward 550 as the reversal gains momentum.
Base Case: Price consolidates between roughly 480.20 and 530.50 without a decisive move either way, as the market digests the recent trendline break.
Bear Case: Price closes inside the 478.70 to 480.20 flip zone, invalidating the current buying setup, with a further slide below 466.50 putting the entire reversal structure at risk.
Disclaimer
This price prediction is prepared for informational purposes only and should not be treated as financial or investment advice. Cryptocurrency markets, including ZEC, are highly volatile, and leveraged trading carries significant risk of loss, including liquidation as shown in the data above. Readers should conduct their own research and consult a qualified financial advisor before making any investment decisions. CoinGabbar and the analyst preparing this piece do not hold a position at the time of publication.