Something shifted for eCash overnight, and traders noticed fast. This eCash price prediction looks at why $XEC jumped so hard, what the chart is now saying, and whether the move has legs. A q
Something shifted for eCash overnight, and traders noticed fast. This eCash price prediction looks at why $XEC jumped so hard, what the chart is now saying, and whether the move has legs. A quiet coin does not move 24% in a day without a reason, so what changed?
Why Is Everyone Suddenly Talking About XEC Today
This eCash price prediction starts with a simple fact: $XEC ripped higher while most of the market stayed flat. That kind of move gets attention fast.
Money didn't just appear from nowhere. Traders watchingaltcoin market trends saw capital rotating out of majors and into smaller names, and $XEC caught a big share of it.
Turns out, the timing lined up with a wallet update and renewed chatter around the network's payment use case. Coincidence or not, buyers showed up in size.
Basically, when a coin outperforms a down market pulled from thelatest crypto news today, people ask questions. Is this sustainable or just a quick squeeze that fades by the weekend?
Key Takeaways
Direction: Short-term bullish, long-term outlook depends on follow-through
Reason: Altcoin rotation plus a breakout above the 50 EMA
Short-term range: $0.0000067 to $0.0000096
Invalidation: A close below $0.0000056 weakens the setup
$XEC Coin Overview: Price, Volume and Key Numbers TodayMetricValueCoin NameeCashTicker SymbolXECBlockchaineCash (Avalanche-enabled UTXO chain)Today High$0.0000083216Today Low$0.0000069802RSI Level73.52 (4H)Token TypeUtility, Digital CashToken CategoryPaymentsMarket Cap$156.96M24H Trading Volume$47.22M24H Trading Volume Change+21.05%Circulating Supply20.05T XEC24H Change+23.98%
Source: Data byCoinMarketCap eCash page
What Exactly Is eCash and Why Does It Even Exist
eCash, or XEC, is a fork of the Bitcoin ABC codebase built for fast, low-fee digital cash payments. It runs on its own chain and uses Avalanche consensus for near-instant finality.
The project launched in 2021 and has stuck around because its team keeps shipping, most recently through its Cashtab wallet.
Why This eCash Rally Is More Than Just Hype
According to the project's official X account, a new Cashtab wallet update rolled out with fresh send and receive tools for everyday spending, and that landed right as the price started climbing.

Source: Posted on X by eCash (@eCash)
And it isn't just the eCash team talking. Blockchain Poker, a crypto platform, publicly backed XEC's design around security, fast payments, and real utility in a recent thread, arguing that most coins won't matter in ten years and asking which projects are actually built to last.
Source: Blockchain Poker X Post (@BlockchainPoker)
Bitcoin ABC, the software team behind the chain's core client, also shipped an update this week. Version 0.33.8 brought performance improvements to the signature algorithms used on the network. That's a small technical detail, but it points to active development.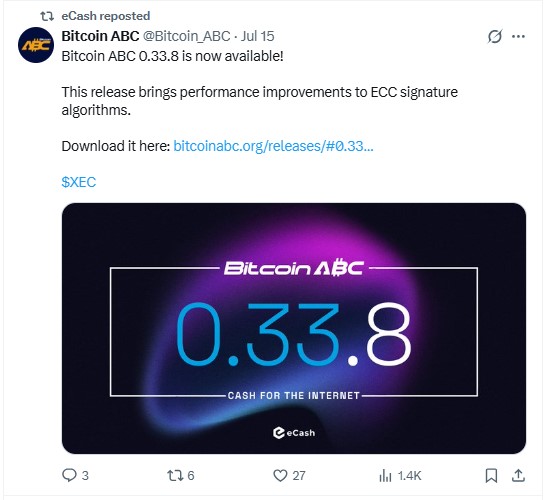
Source: Bitcoin ABC X post (@Bitcoin_ABC)
eCash Liquidation Data: How Much Got Wiped Out
As per CoinGlass, all the liquidations came from shorts, not longs. Across the 1H, 4H, 12H, and 24H windows, shorts lost $3.65 each time while longs lost $0. The flat number across every timeframe suggests it was one small short position getting squeezed early, not a bigger cascade.
Source:Liquidation data by CoinGlass
Fundamental Analysis: What's Actually Driving XEC Right Now
According to CoinMarketCap, the CMC Altcoin Season Index jumped sharply, and that rotation pulled fresh volume into smaller caps.
We pulled up the volume data, and the first thing that stood out was how concentrated it is. As per CoinGlass, MEXC alone carried $1.57M in spot volume, with KuCoin a distant second at $143.95K.
XEC Technical Analysis: Price Breaks Higher Inside Ascending Channel
Fundamentals aside, the chart backs up the move. According to TradingView chart analysis, XEC is trading inside a 4H ascending channel and just pushed toward its upper band.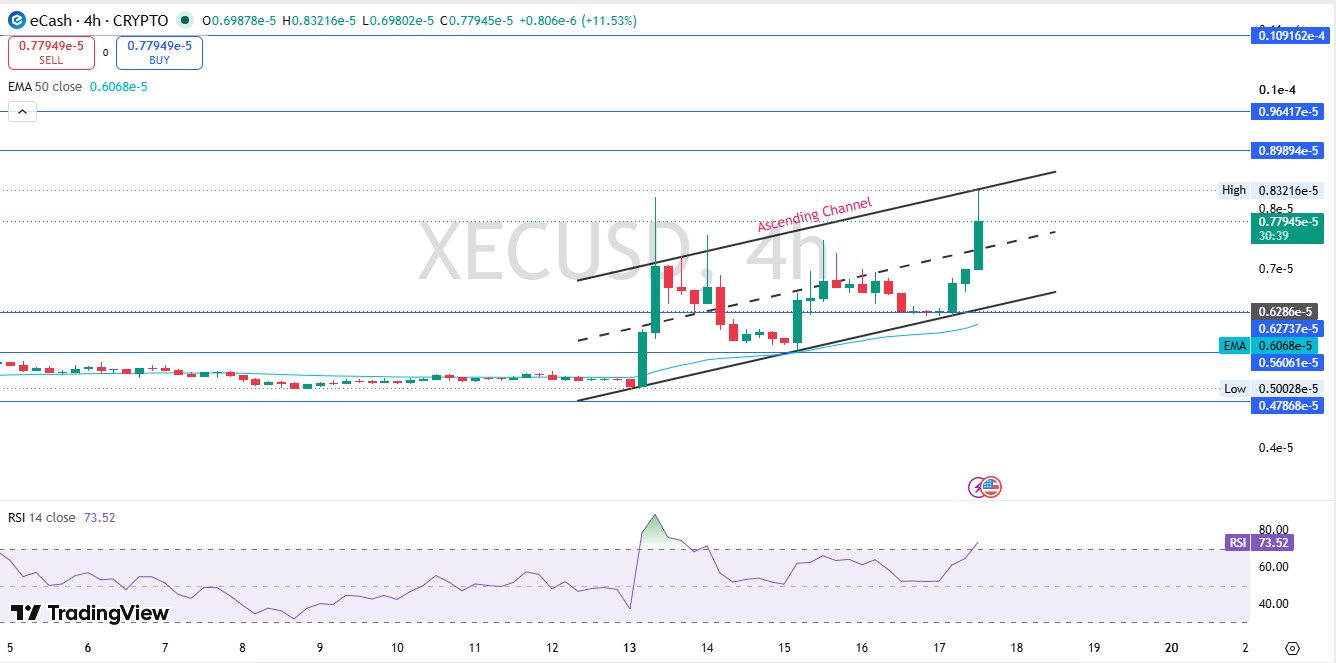
Source: Charts by TradingView
Price sits above the 50 EMA at $0.0000060678, and that's a bullish signal on its own. RSI reads 73.52, deep into overbought territory, which means a pause or pullback wouldn't be shocking here.
Support sits at $0.0000062737, with a harder floor near $0.0000056061. Above the price, resistance stacks at $0.0000089894 and then $0.0000096417. A close above the channel top with real volume opens room toward those levels. Fail there, and consolidation is the more likely next chapter.
Volume Heatmap: Where Most of the Trading Is HappeningExchangeSpot VolumeMEXC$1.57MKuCoin$143.95K
Source: Volume heatmap by CoinGlass
Short-Term eCash Price Prediction: What the Next Few Weeks Could Bring
The next few days will likely decide whether this breakout holds or fades back into the channel.
TimeframeBearish FibBearish TargetBullish FibBase TargetBullish TargetInvalidation24 Hours0.786$0.00000734791.272$0.0000089894$0.0000096417Close below key support3-7 Days0.618$0.00000679061.618$0.0000095435$0.0000107773Lose swing low2-4 Weeks0.500$0.00000636982.618$0.0000107773$0.0000135292Weekly close below support
Source: TradingView (4H) | Trend-Based Fibonacci Extension | Market Structure
Watch the $0.0000073479 zone. Lose it fast, and the whole setup changes.
Long-Term eCash Price Prediction: Where XEC Could Head This Cycle
Zooming out, the weekly chart shows $XEC breaking a multi-month downtrend for the first time since 2021.
TimeframeBearish FibBearish TargetBullish FibBase TargetBullish TargetCatalyst Needed3 Months0.786$0.00000679061.272$0.0000095435$0.0000107773Hold weekly support and rising volume6 Months0.618$0.00000636981.618$0.0000107773$0.0000143433Ecosystem growth and sustained demandEnd of Year0.500$0.00000580002.618$0.0000143433$0.0000180000Break above major weekly resistance2027 Outlook0.382$0.00000500004.236$0.0000201130$0.0000250000New cycle high, wider payments adoption
Source: TradingView (Weekly) | Trend-Based Fibonacci Extension | Macro Trend Analysis
The long-term case is decent, not spectacular, and it tracks closely with the broaderBitcoin bull-bear base case scenarios shaping this cycle. It needs sustained volume, not just one good week, to hold up.
Three eCash Price Scenarios Traders Are Watching Closely
Worst Case: Momentum fades, short sellers return, price slips back under $0.0000056061 and retests the base of the channel.
Base Case: $XEC holds the channel, chopping between support and resistance while the market digests this week's move.
Best Case: Volume stays strong, price clears $0.0000096417, and the weekly downtrend break gets confirmed with a higher close.
ScenarioPrice RangeWhat Triggers ItWorst Case$0.0000048 - $0.0000056Momentum fades, volume dries upBase Case$0.0000063 - $0.0000090Sideways chop, mixed volumeBest Case$0.0000096 - $0.0000135Breakout confirmed, strong volumeKey eCash Price Levels Every Trader Should Watch
Resistance zone: $0.0000089894 to $0.0000096417, the next real test above the price.
Support zone: $0.0000062737, the level buyers defended earlier this week.
Invalidation zone: Below $0.0000056061, where the bullish structure breaks down.
Analyst View and Final Thoughts on the eCash Price Prediction
The chart looks stronger than the price tag suggests. $XEC broke a long downtrend and is now trading above its 50 EMA with real volume behind it.
RSI at 73.52 is stretched. That doesn't kill the trend, but it does raise the odds of a cooling off period before the next leg.
A weekly close above $0.0000078 would tell a different story: that buyers aren't done yet. And that raises a bigger question: whether this rotation into altcoins keeps feeding coins like $XEC over the next few weeks, something worth checking against the broaderCrypto Fear and Greed Index too.
One thing worth tracking outside the chart is exchange listings and wallet adoption data, along with capitalmoving from Bitcoin to Ethereum and other majors, since payment coins live or die on actual usage, not just speculation.
$0.0000073479 is the level that matters most right now. Lose it, and the story changes fast.
Risk Factors Behind This eCash Price Move
Liquidity risk: Volume is concentrated on one exchange, MEXC, which can exaggerate moves both ways.
Volatility risk: RSI near 74 means a sharp pullback is a real possibility, the kind that hit during the recentcrypto market crash news around Bitcoin and Ethereum weakness.
Thesis breaker: A weekly close back under $0.0000056061 would undo the bullish structure.
Disclaimer: This article is for educational purposes only and does not constitute financial advice. Crypto markets are volatile. Consult your investment advisor before making any investment decision.