Polygon trades at $0.0913, roughly 53 per cent below its twelve-month high of $0.1952. A token that has lost more than half its value in a year draws two very different kinds of buyer: those
Polygon trades at $0.0913, roughly 53 per cent below its twelve-month high of $0.1952. A token that has lost more than half its value in a year draws two very different kinds of buyer: those who see a discount, and those who see a market that keeps saying no. The question this article answers is which of the two the chart currently supports.
The price data in this article was compiled by cryptoticker.io from the daily closing prices of CoinMarketCap on 30 October 2026. Moving averages, the RSI and the distances to the high and the low are calculated from the same series of 365 daily closes.
Polygon price analysis: the POL price between $0.0684 and $0.1952
The range of the past twelve months is wide. The twelve-month high of $0.1952 dates from exactly one year ago, the twelve-month low of $0.0684 from 1 July 2026. At $0.0913, POL sits 53 per cent below that high and 33 per cent above that low. Anyone buying today is buying neither at the floor nor into a running advance.
What matters more than the extremes is the zone the price has occupied since the summer. Between roughly $0.090 and $0.100 the market has been trading sideways for weeks. The 200-day moving average sits at $0.0966 and marks the upper edge of precisely that zone, which turns a statistical line into a practical ceiling: every attempt to leave the range upwards has run into it.
Size belongs in the picture too. With a market capitalisation of $0.97bn, Polygon ranks 61st in the overall market and has slipped just outside the top 60. A year ago the same network carried roughly twice that valuation. The token supply has not shrunk in the meantime, so the repricing happened through the price alone.
Polygon downtrend: broken or merely interrupted?
Over 90 days POL is up 26 per cent, over 30 days it is down 19 per cent, and over seven days it has barely moved at 0.4 per cent lower. Those three figures describe the shape of the move: a recovery from the July low, then a loss of momentum, then a standstill.
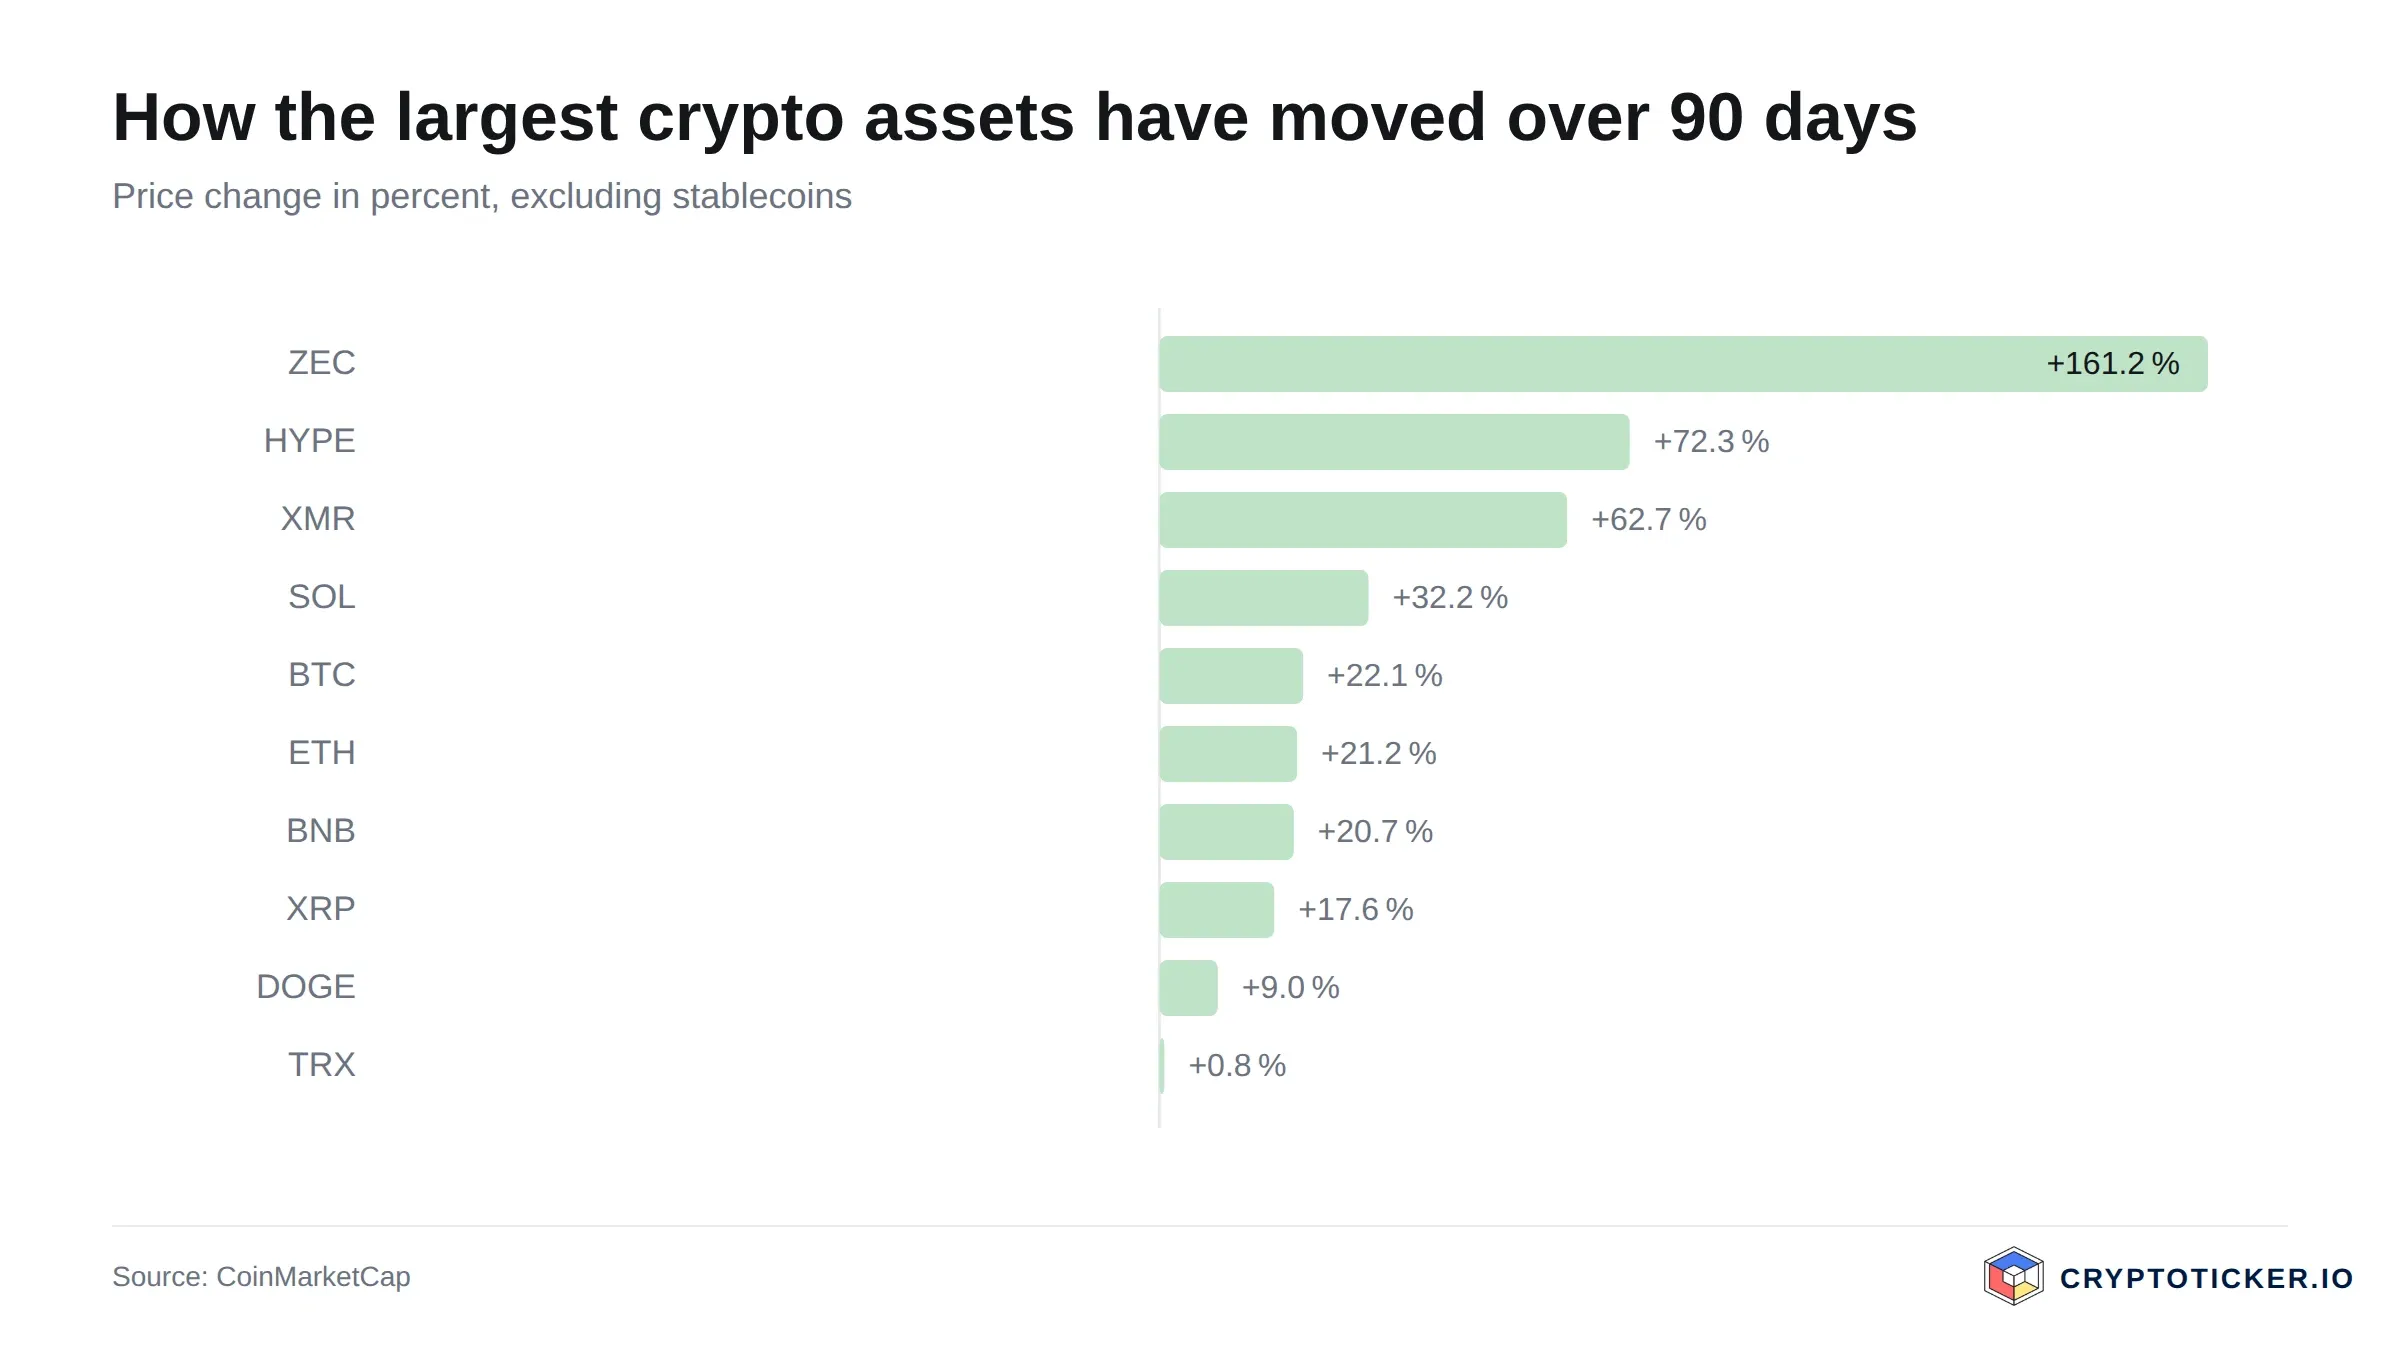
The largest crypto assets compared over 90 days, according to CoinMarketCap data
Technically, the series of lower lows ended on 1 July. The low of $0.0684 has held since, and the subsequent setbacks stopped above it. That is the minimum requirement for a trend change, and it has been met. The second requirement has not: a trend only turns once the price takes out the highs of the previous move, and for POL that means a daily close above $0.100 and above the 200-day line at $0.0966.
So the honest answer is interrupted rather than broken. The downtrend has lost its drive, but nothing has replaced it. Where the longer-term marks run is set out in our Polygon price prediction; for an entry decision today, the $0.100 mark is the one that counts.
RSI and moving averages: what they mean for a Polygon entry
The 14-day RSI stands at 41.8. That is below the midpoint of 50 and therefore in the weaker half of the scale, but a long way from the oversold reading of 30 that bargain hunters wait for. Anyone looking for the classic entry signal of an exhausted sell-off will not find it here. The RSI says the selling pressure has eased without buyers taking control.
The moving averages are more interesting. The 50-day average sits at $0.0974, the 200-day average at $0.0966. The two lines are only 0.8 per cent apart, and the shorter one sits marginally above the longer one. When a fast and a slow average converge like this, the market has no trend on either time frame: the average price of the past two months is almost identical to the average price of the past year.
At $0.0913 the price is 5.5 per cent below the 200-day line and 6.3 per cent below the 50-day line. For an entry that cuts both ways. The downside is that buying below both averages means buying into weakness. The upside is that the two lines sit close together and close above the price, so the distance to the first real resistance is small and measurable rather than a matter of guesswork.
Trading volume: what it reveals about demand for Polygon
In the past 24 hours $162m of POL changed hands. Measured against a market capitalisation of $0.97bn that is a turnover of around 17 per cent of the network's value in a single day, a high figure for a token outside the top 50. The practical consequence matters more than the ratio: order books of this depth absorb mid-sized orders without the price jumping. Polygon is liquid, and that lowers the cost of both entering and leaving.
High turnover with a flat price also says something about who is trading. A lot of volume is being moved without either side prevailing, which means buyers and sellers are evenly matched around the $0.090 mark. For a buyer that is neutral news. It becomes relevant only when the volume rises on a day with a clear direction, because that is the pattern that usually confirms a break out of a range rather than a false start.
Structural factors: what speaks for Polygon
The most important change at token level is already complete: POL has replaced MATIC as the native token of the network, with a one-to-one migration. Anyone still holding MATIC is holding the predecessor. There are 10.64bn POL in circulation, and the market data shows no fixed maximum supply, so the total can keep growing. That is a difference from bitcoin and a point every buyer should price in rather than wave away.
On the usage side, Polygon remains one of the established scaling networks around Ethereum, with payments and stablecoin transfers as the visible workhorse. The staking model and the technical roadmap are documented on the project's own site. For holders the practical point is that POL can be staked to secure the network, which turns part of the position into a yield rather than a pure price bet.
Regulation is the third factor, and in Europe it currently works in favour of established tokens. Under MiCA, trading venues serving EU customers have to be licensed, and the European Securities and Markets Authority publishes the registers. A token already listed on licensed venues clears a hurdle that newer tokens still have in front of them.
Three points in favour of buying Polygon at the current price
First, the measurable distance to resistance. At $0.0913 the price sits 5.5 per cent below the 200-day line. Should the market take out that line and hold it, the next technical target is the upper edge of the summer range. A buyer today knows the exact level at which the thesis starts to work.
Second, the floor that has held. The $0.0684 low from 1 July has survived four months of weak market conditions. Buying 33 per cent above a tested low is a different proposition from buying into an unbroken decline, because the level at which the thesis fails is also known.
Third, liquidity and the yield component. A daily turnover of 17 per cent of market capitalisation keeps spreads tight, and staking pays a return on the position while the price does nothing. For a position intended to be held for longer, that combination is worth more than a good entry price.
Three points against buying Polygon at the current price
First, the trend is not yet on the buyer's side. The price sits below both moving averages, and the RSI at 41.8 shows no exhaustion of the selling. In this configuration a position usually has to sit through a longer flat phase before anything happens, and every week in that phase is capital that is not working elsewhere.
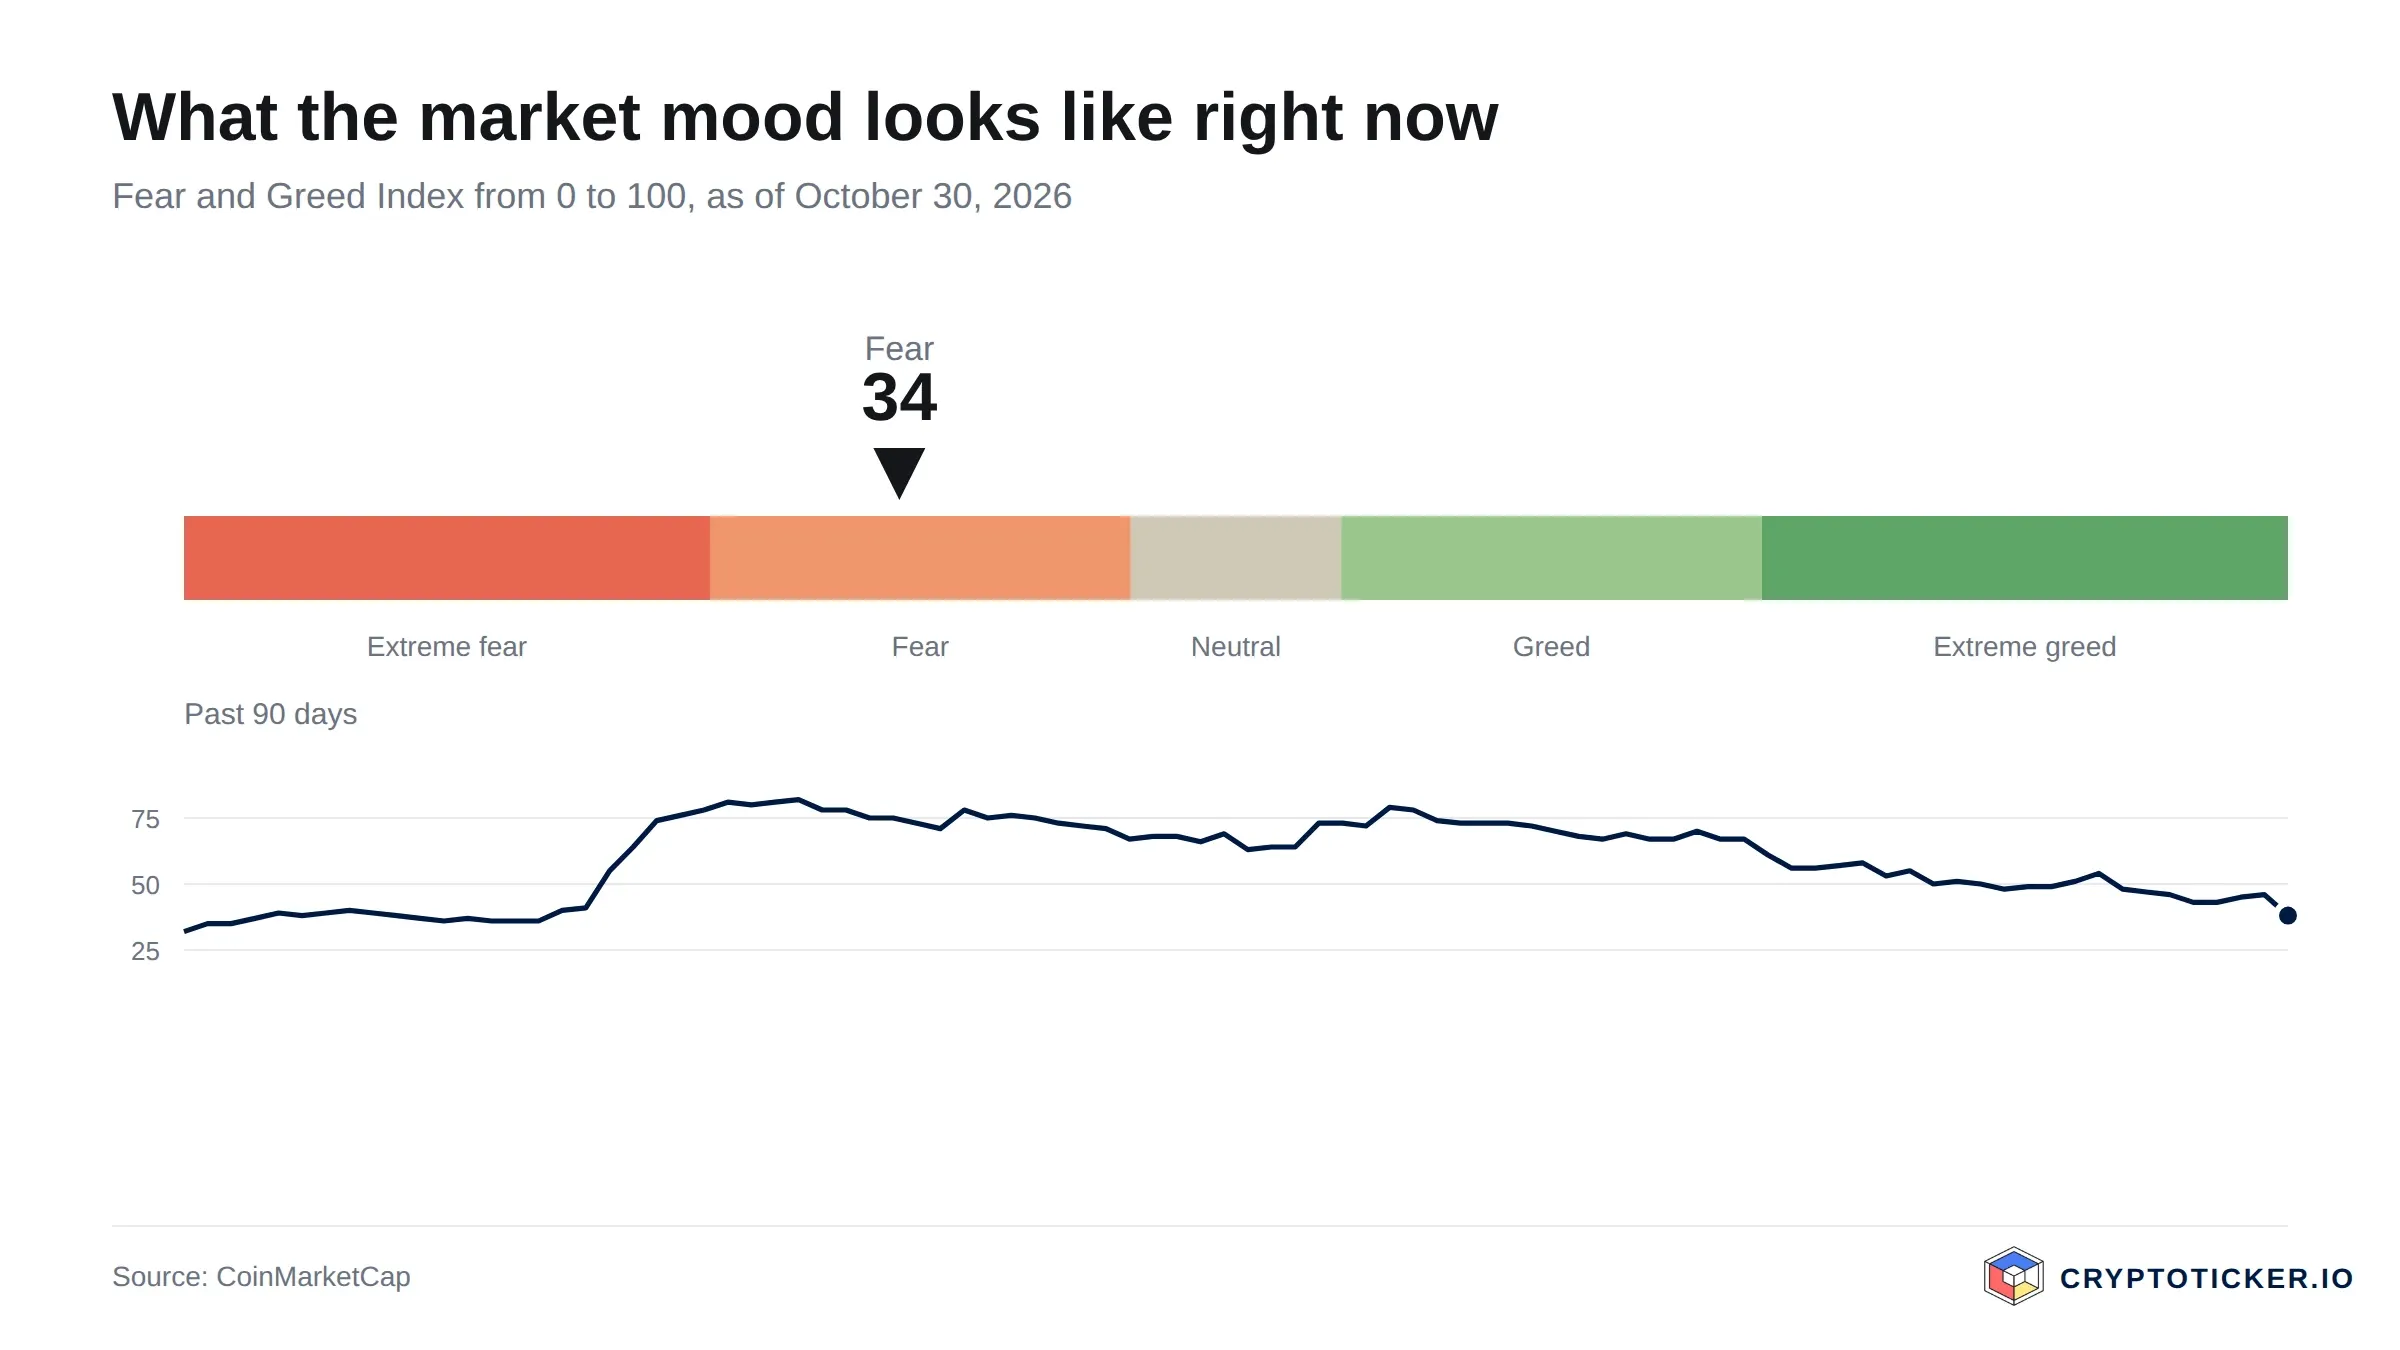
The Fear and Greed Index places market sentiment between extreme fear and extreme greed
Second, the supply. With 10.64bn POL in circulation and no fixed cap, new tokens can keep entering the market. Where supply grows, demand has to grow faster for the price to rise. That is a structural headwind that no chart mark removes.
Third, the year-on-year comparison. A loss of 53 per cent over twelve months is not a pause in an uptrend, it is a repricing. The market has valued this network at half what it did a year ago, and the 90-day recovery of 26 per cent has recovered only a fraction of that. Anyone buying here is betting against a judgement the market has already made, and that bet needs a reason beyond the low price.
The wider market mood does not help either. The Fear and Greed Index stands at 35 and therefore in the fear range, which historically has meant low appetite for tokens outside the top tier.
Polygon in your portfolio: costs, custody and providers
Three cost blocks decide what an entry at $0.0913 actually costs. The trading fee is the visible one, usually between 0.1 and 1.5 per cent depending on the venue and the payment method. The spread is the invisible one, and with POL's liquidity it is narrow on the large venues and noticeably wider on small ones. The withdrawal fee applies when the token leaves the venue, and it is charged per transaction rather than as a percentage, which makes small withdrawals expensive.
For custody, the choice is between the venue and your own wallet. Leaving the token on the trading venue is convenient and keeps staking simple, but the keys are not yours. A hardware wallet puts the keys in your hands and costs an upfront sum plus the discipline of a backup. Which venues hold an EU licence and what they charge is set out in our comparison of regulated crypto exchanges; what trading on an established provider looks like in practice is covered in our Kraken review.
Is Polygon a good buy at current prices? Short term and long term separated
For the short term, the chart does not support a purchase. The price sits below both averages, the RSI shows no oversold reading, and the volume shows no direction. Whoever buys now for a move within weeks is buying a range, and ranges pay nothing. The honest short-term answer is to wait for a daily close above $0.0966 and to treat that close, not the current price, as the signal.
For the long term the picture is more open. The floor at $0.0684 has held, the network carries real payment traffic, the token can be staked, and the valuation is half of what it was a year ago. On a horizon of several years that is a position worth considering as a small part of a portfolio, in instalments rather than in one go, with the open supply priced in.
The assumption behind that is falsifiable, and these are the conditions under which it fails: a daily close below $0.0684 breaks the floor and removes the central argument. A drop in daily turnover below five per cent of market capitalisation would mean the liquidity advantage is gone. And if the 50-day line falls decisively below the 200-day line, the flat phase has turned back into a downtrend. None of the three has happened. Any of the three would be a reason to review the position rather than to sit it out.
Buying Polygon: What to take away
- Note the two marks before you buy: $0.0966 as the line that has to fall for the chart to turn, and $0.0684 as the low whose loss would invalidate the thesis. Our Polygon price prediction sets out the longer-term levels.
- Pick the venue by licence and total cost, not by the headline fee. Our comparison of regulated exchanges lists which providers hold an EU licence.
- Decide on custody before the first purchase, because moving a position later costs a withdrawal fee each time. How buying and withdrawing works at a licensed European provider is described in our Bitpanda review.
Disclosure: Some of the providers mentioned in this article work with us through partner programmes. This has no influence on the price analysis or on the assessment of the chart situation; the price data comes from a public market data source and can be verified there.
(Last updated: 30 October 2026. This article is not investment advice. Prices, fees and terms change; check them with the provider before every purchase. Crypto assets are subject to high price volatility, and a total loss is possible.)